- Home
- >
- Blog
- >
- Image reconstruction
- >
- Attenuation correction for brain…
Menu
Attenuation correction for brain PET-MR imaging studies
Identifying bone tissue is particularly relevant for accurate attenuation correction in neurological PET studies as this tissue class has the highest linear attenuation coefficient and inaccuracies in its estimation can introduce large biases in the adjacently located cortical structures. Since using conventional MRI pulse sequences bone tissue and air-filled cavities are difficult to distinguish, novel sequences have been developed to address this challenge. We were among the first to propose using ultra-short echo time MR sequences (optimized for imaging tissues with very short T2 relaxation times) for generating segmented head attenuation maps. In a first approach, the head was segmented into three compartments (i.e. bone and soft tissue and air cavities) based on the relationship between the two echoes on a voxel-by-voxel basis (Catana 2010).
Subsequently, combining the dual-echo UTE and T1-weighted MR data using probabilistic atlases allowed the generation of substantially improved segmented attenuation maps (Poynton, Chen et al 2014). However, one of the main limitations of early generation UTE-based methods was that only three compartments (i.e. soft tissue, bone, and air cavities) could be identified.
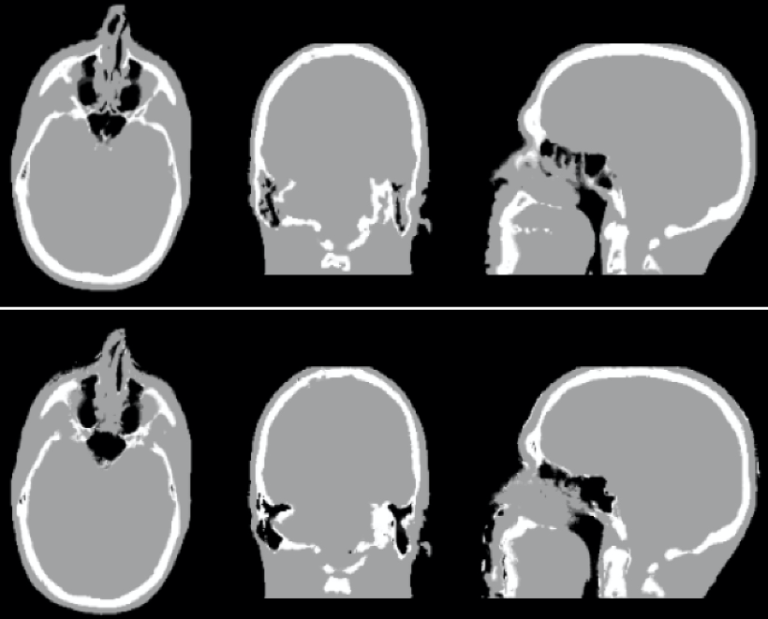
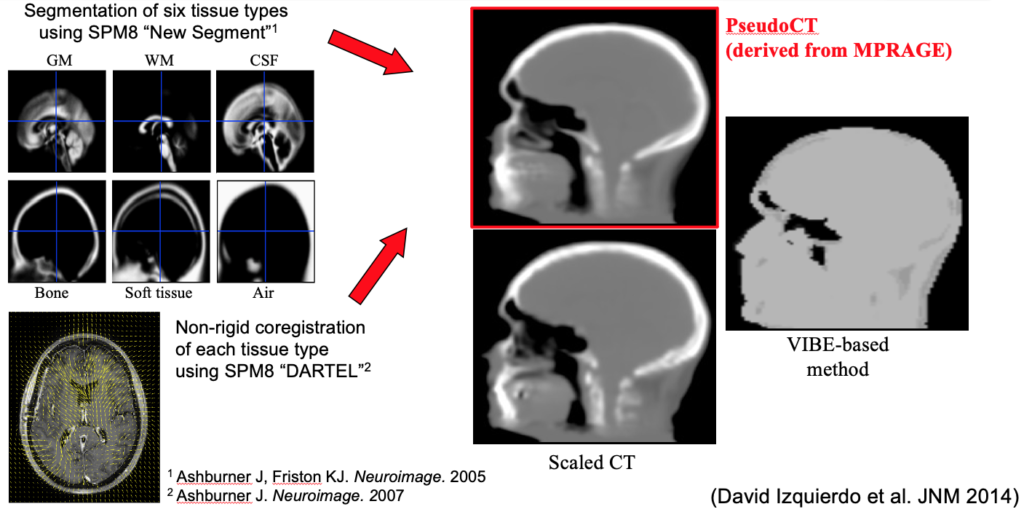
We next implemented an SPM-based method for generating head attenuation maps from a single morphological MRI dataset obtained with the MPRAGE sequence routinely collected in research neurological studies (Izquierdo-Garcia et al 2014). After intensity normalization, the MR images are segmented into six tissue classes using the “New Segment” SPM tool and then registered to a previously created template using a diffeomorphic non-rigid image registration algorithm (SPM DARTEL). The inverse transformation is applied to obtain the pseudo-CT images in the subject space. Using this approach, the voxel- and regional-based quantification errors compared to the scaled CT method were 3.87±5.0% and 2.74±2.28%, respectively. This method was also demonstrated to work in patients with modified anatomy (e.g. glioblastoma patients post-surgery). This method and several of the others developed by other groups around the world have been shown in a multi-center evaluation to be quantitatively accurate to a degree “smaller than the quantification reproducibility in PET imaging” (Ladefoged 2017). Continuous-valued attenuation maps were also obtained from dual-echo UTE and T1-weighted MR data using probabilistic atlases (Chen et al 2017). We also assessed the repeatability of the atlas- or UTE-based methods. For example, comparable attenuation maps and PET volumes were obtained at three visits using the probabilistic atlas method (Chen et al 2017). Similar results were reported for the SPM-based method (Izquierdo-Garcia et al 2018).
Software
- Masamune (includes several methods for generating head attenuation maps from MR or PET data)
- Stand-alone PseudoCT for the generating head attenuation maps for BrainPET and Biograph mMR studies
Attenuation correction for brain PET imaging